GitLab Runners, GCP, and MTUs, oh my!
By Chad Hodges, Infrastructure Engineer
We recently prioritized moving some pipelines from GitLab shared runners to self-hosted runners, with the goal of improving their performance and increasing isolation. In addition, we looked at the instance types in use to ensure that we made smart trade-offs around time and costs.
In this post, we’ll briefly cover the relevant configuration, touch on how to access individual Gitlab runners when running in an autoscaling configuration, and take a minor detour into some issues we worked through. We’re focused on Google Cloud Platform (GCP) in this post, but the concepts are applicable regardless of your cloud provider.
GitLab runners configuration
We’re a cloud-first company, running in multiple Public Cloud environments. We use the GitLab Software-as-a-Service (SaaS) offering coupled with self-hosted runners for CI/CD pipelines.
There are many different ways to configure GitLab runners; we’ve chosen the docker+machine executor in order to use autoscaling.
This means that we utilize a Virtual Machine (VM) that runs the runner manager process in a Docker container. The runner manager process relies on the config.toml file for configuration, coordinating jobs and dynamically managing the number of VMs available. At Unit 410, the configuration is managed using a combination of Terraform and Ansible.
In this configuration, users can login to the runner manager and use docker-machine to check the status of their runners as well as access individual runners for troubleshooting/analysis. Here are some practical examples:
List virtual machines that the runner manager has configured to process jobs
gitlab-runner-manager:/# docker-machine ls
NAME                                                   ACTIVE   DRIVER   STATE     URL                      SWARM   DOCKER    ERRORS
runner-redacted   -    google   Running   tcp://192.168.0.67:2376
runner-redacted   -    google   Running   tcp://192.168.0.103:2376
runner-redacted   -    google   Running   tcp://192.168.0.124:2376
runner-redacted   -    google   Running   tcp://192.168.0.112:2376
runner-redacted   -    google   Running   tcp://192.168.0.110:2376
runner-redacted   -    google   Running   tcp://192.168.0.113:2376
…
Login to a specific runner
gitlab-runner-manager:/# docker-machine ssh runner-redacted
Welcome to Ubuntu 22.04.3 LTS (GNU/Linux 6.2.0-1019-gcp x86_64)

 * Documentation:  https://help.ubuntu.com
 * Management:     https://landscape.canonical.com
 * Support:        https://ubuntu.com/pro

  System information as of Mon Jan 22 17:21:34 UTC 2024

  System load:  0.0                Processes:                110
  Usage of /:   3.1% of 193.65GB   Users logged in:          0
  Memory usage: 9%                 IPv4 address for docker0: 172.17.0.1
  Swap usage:   0%                 IPv4 address for ens4:    10.128.0.67
…
Configuring auto-scaling
In our production environment, we keep 15 machines ready for jobs between 7 AM and 9 PM Eastern Time on weekdays. Outside of that window, we scale down to 0 machines so new CI/CD jobs are fulfilled on demand.
This is accomplished via the following configuration in /etc/gitlab-runner/config.toml, nested under the [runners.machine] section:
# https://docs.gitlab.com/runner/configuration/autoscale.html#autoscaling-periods-configuration
    [[runners.machine.autoscaling]]
      Periods = ["* * 7-21 * * mon-fri *"]
      IdleCount = 15
      IdleTime = 900
      Timezone = "America/New_York"
    [[runners.machine.autoscaling]]
      Periods = ["* * * * * sat,sun *"]
      IdleCount = 0
      IdleTime = 300
      Timezone = "America/New_York"
Observability of GitLab Runners in GCP using OS Policies
One goal was understanding the optimal machine size for a subset of jobs. The runner process exposes prometheus metrics on port 9252 by default, and, as we run prometheus, this was a natural place to start. As noted in the previous link, one can get a list of available metrics by curling the endpoint:
gitlab-runner-manager:/# curl -s "http://localhost:9252/metrics" | grep -E "# HELP"
# HELP gitlab_runner_api_request_duration_seconds Latency histogram of API requests made by GitLab Runner
# HELP gitlab_runner_api_request_statuses_total The total number of api requests, partitioned by runner, system_id, endpoint and status.
# HELP gitlab_runner_autoscaling_actions_total The total number of actions executed by the provider.
# HELP gitlab_runner_autoscaling_machine_creation_duration_seconds Histogram of machine creation time.
# HELP gitlab_runner_autoscaling_machine_failed_creation_duration_seconds Histogram of machine failed creation timings
# HELP gitlab_runner_autoscaling_machine_removal_duration_seconds Histogram of machine removal time.
# HELP gitlab_runner_autoscaling_machine_states The current number of machines per state in this provider.
# HELP gitlab_runner_autoscaling_machine_stopping_duration_seconds Histogram of machine stopping time.
# HELP gitlab_runner_concurrent The current value of concurrent setting
# HELP gitlab_runner_configuration_loaded_total Total number of times the configuration file was loaded by Runner process
# HELP gitlab_runner_configuration_loading_error_total Total number of times the configuration file was not loaded by Runner process due to errors
# HELP gitlab_runner_configuration_saved_total Total number of times the configuration file was saved by Runner process
# HELP gitlab_runner_configuration_saving_error_total Total number of times the configuration file was not saved by Runner process due to errors
…
We spent some time reviewing these metrics and charting them, creating a Grafana dashboard for the most relevant metrics:
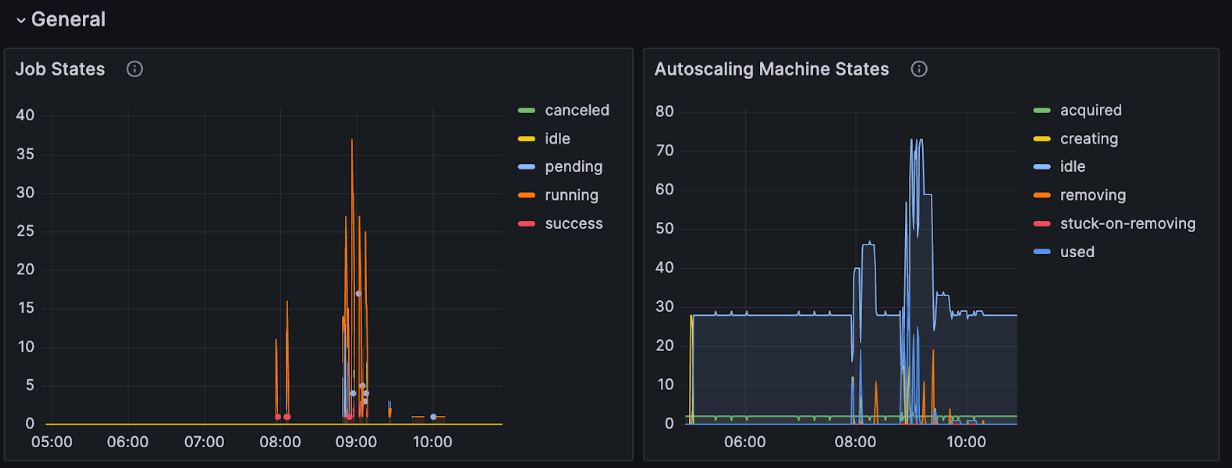
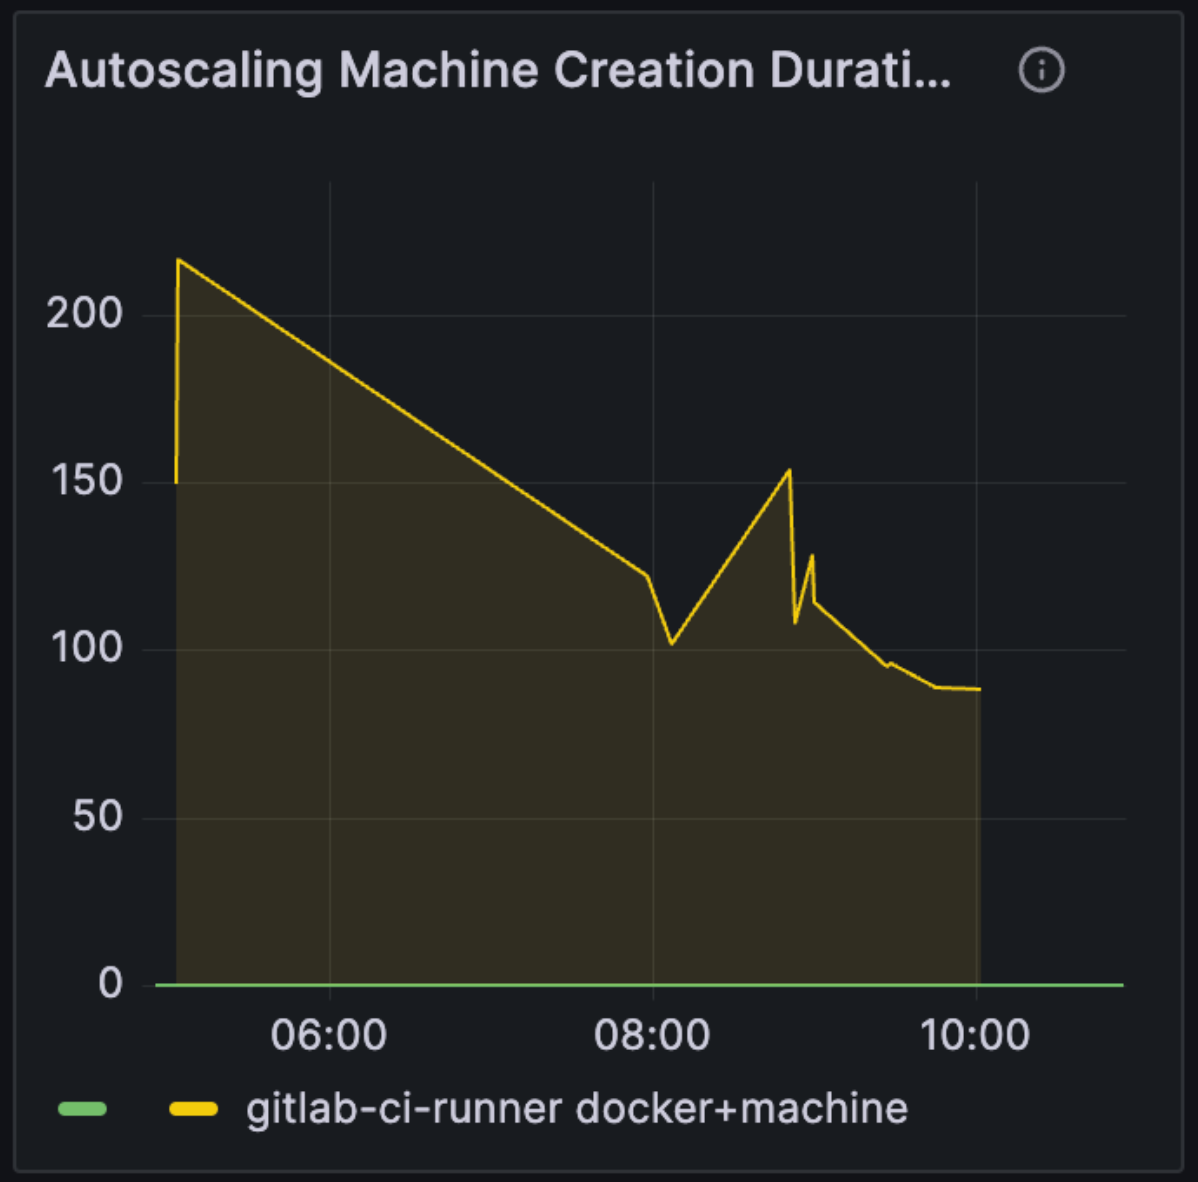
While these are useful for an overall view of the system, they don’t sufficiently reveal insights into the performance of a given instance type. We could leverage existing infrastructure using the prometheus node exporter, but there are a few complications:
- The workers are hosted on a private subnet with no external network connectivity. As a result, scraping the endpoint for metrics is not an option.
- The runner VMs are ephemeral, popping into (and out of) existence regularly. To scrape the metrics, there’d need to be some sort of service discovery mechanism added, and that mechanism would have to be fast enough to gather metrics before a job finished.
- In a similar vein, there’s a need to minimize the customization of the runner VMs as much as possible (they are a prime example of cattle, as opposed to pets).
None of the above are unsolvable. It would be relatively straightforward to set up the appropriate routing and use a packer workflow that creates a custom image with the necessary bits. Service discovery is also solvable - but in researching the problem a bit, we came across GCP’s VM Manager and OS Policies as possible options for GCP environments.
Using GCP’s OS Policies to install the Ops Agent
OS Policies allow one to run configuration actions on hosts based on a set of criteria via an OS Policy Assignment. They support the following resource types:
pkg: used for installing or removing Linux and Windows packages.repository: used for specifying which repository software packages can be installed from.exec: used to enable the running of an ad hoc shell (/bin/sh) or PowerShell script.file: used to manage files on the system.
We use Ansible today to install and configure the Google Ops Agent on hosts - the file and exec resource types in OS policies can do the same thing, allowing the use of Google’s built-in observability. As an added bonus, this usage fits well within the free tier!
Here’s a way to set it up:
- Create a service account to support the OS Config service and grant it the “Cloud OS Config Service Agent” IAM role. This can be done via the GUI, or via the following terraform:
resource "google_service_account" "osconfig_service_account" {
  account_id   = "service-${data.google_project.project.number}"
  project      = var.project
  display_name ="service-${data.google_project.project.number}@gcp-sa-osconfig.iam.gserviceaccount.com"
}

resource "google_project_iam_member" "osconfig" {
  project = var.project
  role    = "roles/osconfig.serviceAgent"
  member  ="serviceAccount:${google_service_account.osconfig_service_account.email}"
}
- Enable the API - one can do this via the GUI, where it’s named “VM Manager OS Config API” or via the following terraform:
resource "google_project_service" "osconfig" {
  project = var.project
  service = "osconfig.googleapis.com"
}
- Set the GCP project’s metadata so that enable-osconfig is true. This is available in the GUI under “Compute Engine->SETTINGS->Metadata” or it can be configured via terraform:
resource "google_compute_project_metadata_item" "osconfig" {
  project = var.project
  key     = "enable-osconfig"
  value   = "true"
}
- Once these steps are complete, VM Manager should be running and available.
One can use the following command to help with troubleshooting:
gcloud compute os-config troubleshoot hostname --zone=zone --project=project
Next, one needs to create the OS Policy and OS Policy Assignment.
This can be done by replicating the Google Ops Agent from a bucket and then installing it using an exec.
If this is being done via the GUI, one will need to create a YAML file with the applicable actions for the OS Policy, which one can upload in the “Create OS policy assignment” dialog:
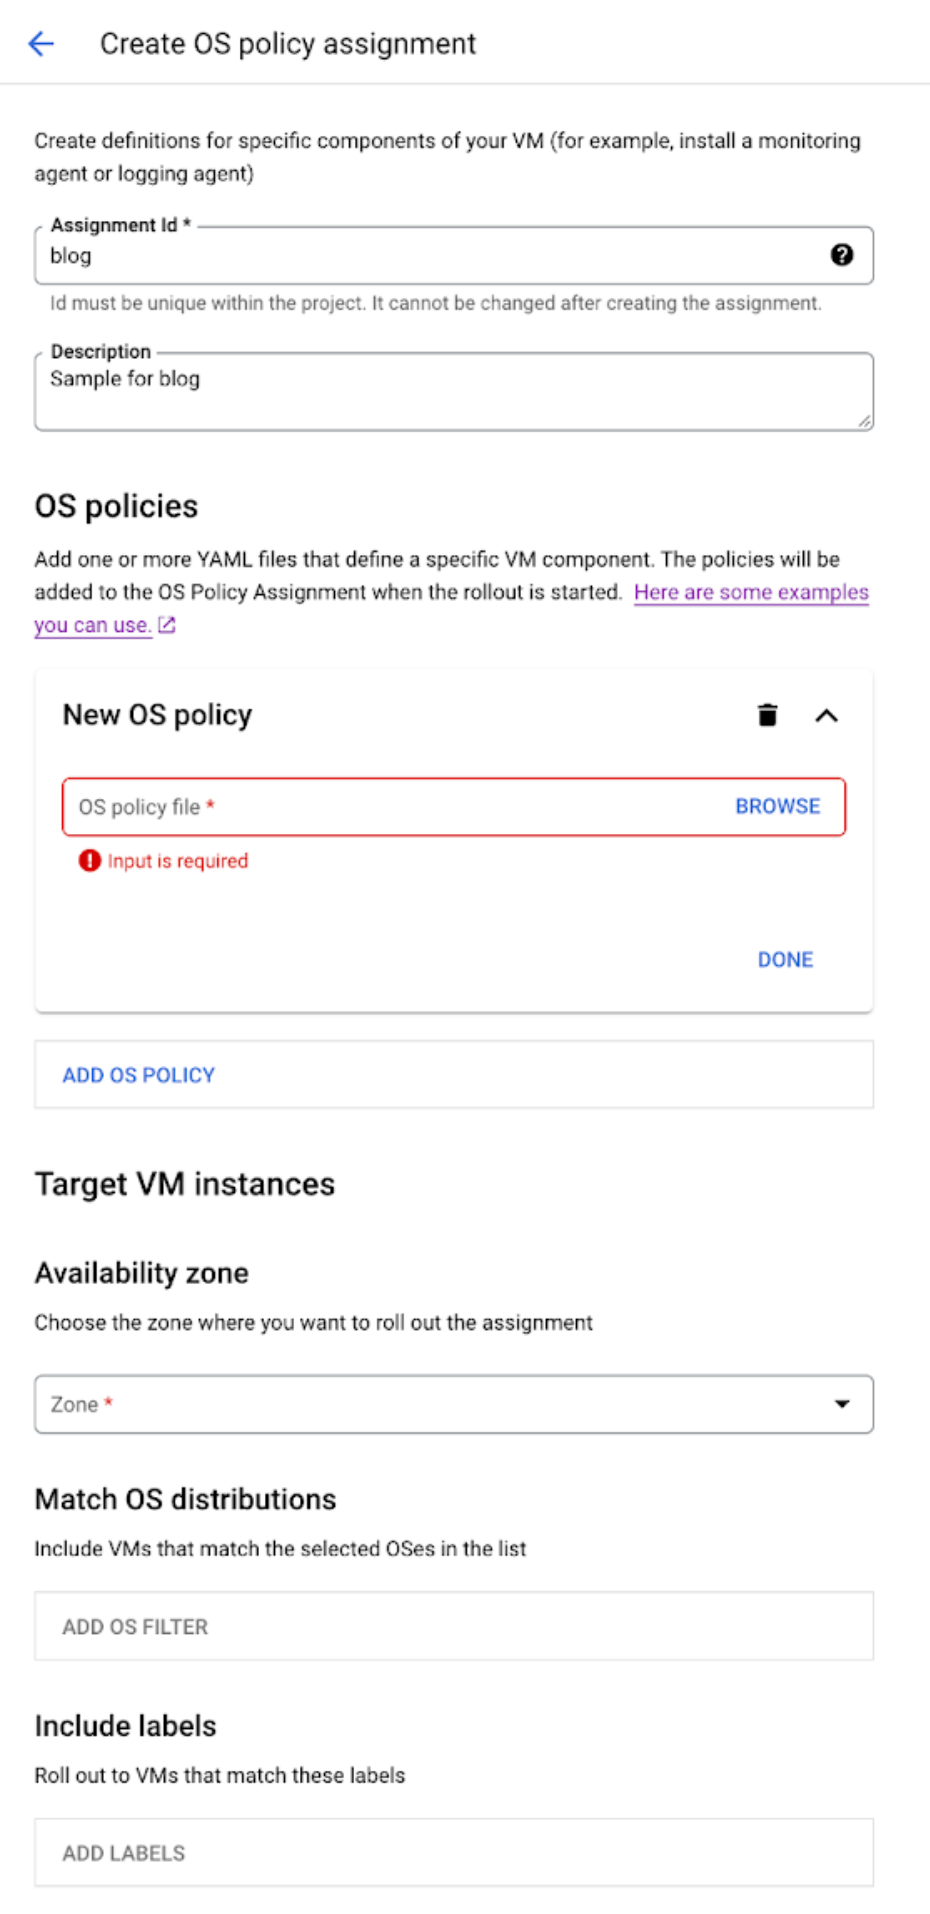
If using Terraform, then the assignment and the policy can both be configured in a single code block:
resource "google_os_config_os_policy_assignment" "install-google-cloud-ops-agent" {
  description = "Install the ops agent on hosts"
  location    = var.zone
  name        = "install-google-cloud-ops-agent"
  project     = var.project

  instance_filter {
    all = false
    inventories {
      os_short_name = "ubuntu"
      os_version    = "22.04"
    }
  }

  os_policies {
    allow_no_resource_group_match = false
    description                   = "Copy file from GCS bucket to local path"
    id                            = "install-and-configure-ops-agent"
    mode                          = "ENFORCEMENT"

    resource_groups {
      resources {
        id = "copy-file"

        file {
          path  = "/local/path"
          state = "CONTENTS_MATCH"

          file {
            allow_insecure = false

            gcs {
              bucket     = "bucket"
              generation = object_generation
              object     = "path_inside_bucket"
            }
          }
        }
      }

      resources {
        id = "install-package"
        exec {
          enforce {
            args        = []
            interpreter = "SHELL"
            script      = "apt-get install -y /local/path && exit 100"
          }
          validate {
            args        = []
            interpreter = "SHELL"
            script      = "if systemctl is-active google-cloud-ops-agent-opentelemetry-collector; then exit 100; else exit 101; fi"
          }
        }
      }
    }
  }

  rollout {
    min_wait_duration = "60s"
    disruption_budget {
      fixed   = 0
      percent = 100
    }
  }

  timeouts {}
}
There are several options for the policy assignment that allow configurations of the hosts that are targeted; for example, how long the rollout will wait and how many machines will update concurrently. For this simple use case, the target is all Ubuntu 22.04 machines and updating them all at once. A more disruptive case may require different options.
Validation and troubleshooting
The status for policies in the GUI can be checked at “Compute Engine->VM MANAGER-> OS policies”, under the “VM INSTANCES” tab:
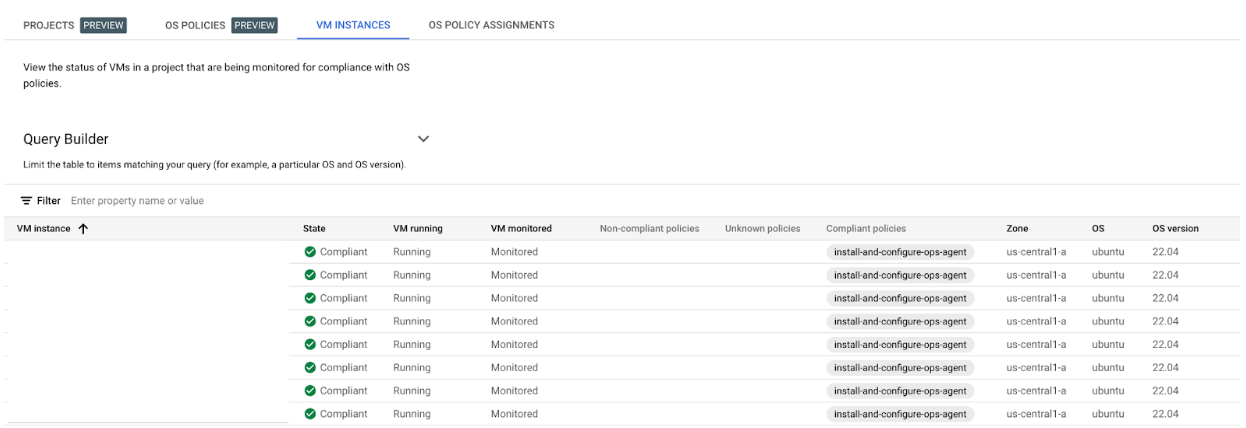
If the policy isn’t compliant, its output is visible in the OSConfigAgent log, in Google’s logging, in the console output for the instance, or in one’s favorite logging tool if forwarding is set up. Here’s an example of a successful run:
Jan 22 13:01:07 runner-redacted OSConfigAgent[496]: 2024-01-22T13:01:07.6126Z OSConfigAgent Info: Beginning ApplyConfigTask.
Jan 22 13:01:07 runner-redacted OSConfigAgent[496]: 2024-01-22T13:01:07.6863Z OSConfigAgent Info: Executing policy "install-and-configure-ops-agent"
Jan 22 13:01:08 runner-redacted OSConfigAgent[496]: 2024-01-22T13:01:08.6122Z OSConfigAgent Info: Validate: resource "copy-file" validation successful.
Jan 22 13:01:08 runner-redacted OSConfigAgent[496]: 2024-01-22T13:01:08.8902Z OSConfigAgent Info: Check state: resource "copy-file" state is COMPLIANT.
Jan 22 13:01:08 runner-redacted OSConfigAgent[496]: 2024-01-22T13:01:08.8908Z OSConfigAgent Info: Validate: resource "install-package" validation successful.
Jan 22 13:01:08 runner-redacted OSConfigAgent[496]: 2024-01-22T13:01:08.8961Z OSConfigAgent Info: Check state: resource "install-package" state is COMPLIANT.
Jan 22 13:01:08 runner-redacted OSConfigAgent[496]: 2024-01-22T13:01:08.8962Z OSConfigAgent Info: Policy "install-and-configure-ops-agent" resource "copy-file" state: COMPLIANT
Jan 22 13:01:08 runner-redacted OSConfigAgent[496]: 2024-01-22T13:01:08.8962Z OSConfigAgent Info: Policy "install-and-configure-ops-agent" resource "install-package" state: COMPLIANT
Jan 22 13:01:08 runner-redacted OSConfigAgent[496]: 2024-01-22T13:01:08.9340Z OSConfigAgent Info: Successfully completed ApplyConfigTask
If the logging doesn’t provide enough detail, the log level for osconfig can be adjusted by setting the project’s metadata so that osconfig-log-level is debug.
Observability
After completing the above, the “OBSERVABILITY” tab in GCP under “Compute Engine -> VM instances” shows the following:
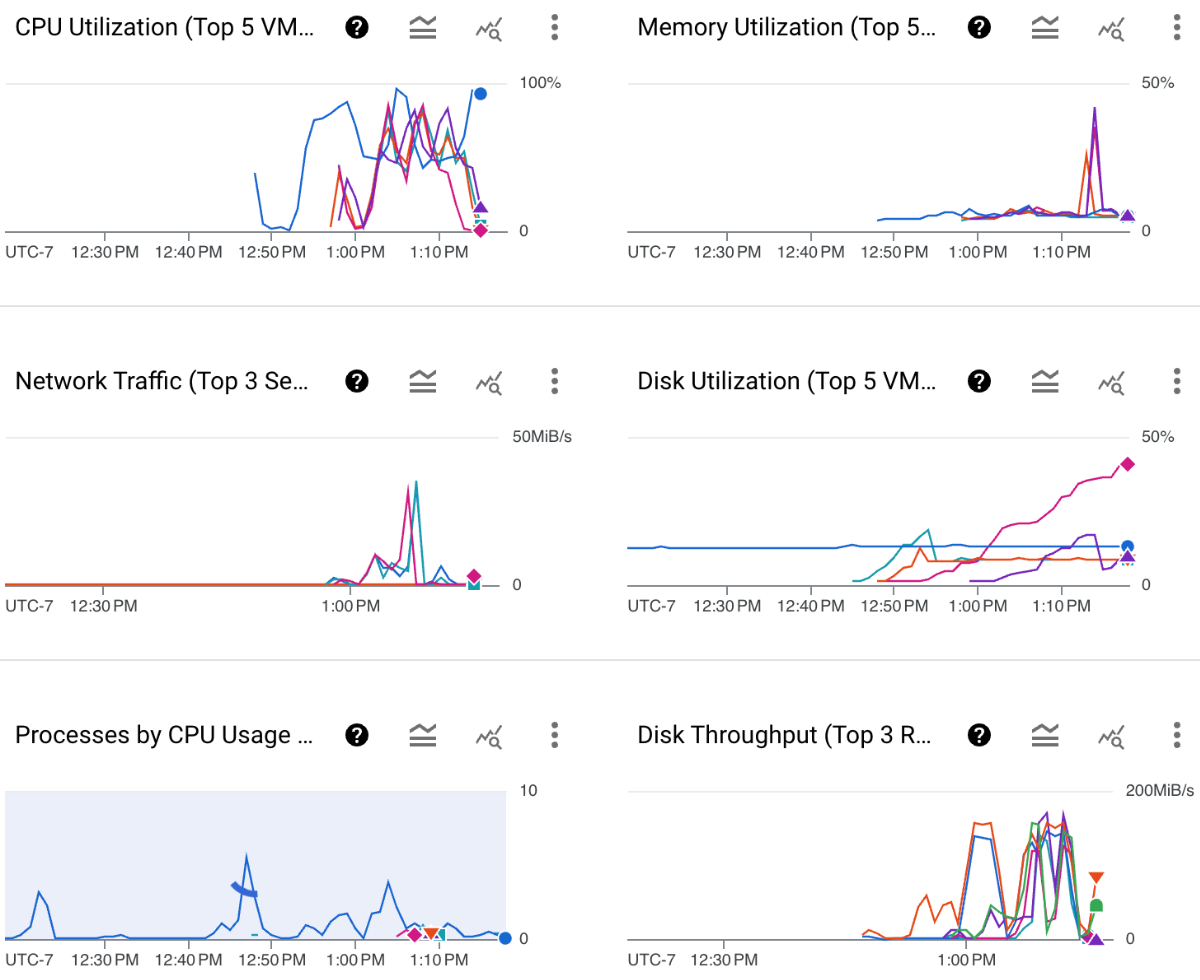
This shows the performance of the VMs as they run jobs. It also provides another tool to configure hosts.
Evaluating different instance types (a detour due to MTU)
We’re ready to look at different instance types. Historically we’ve used n1-standard-2 instances on GCP. They’re both readily available and cost effective, although they are somewhat dated. As part of this process, we wanted to consider the n2, c3, and c3d families as well as evaluate the impact of increasing the number of processors and RAM.
We identified a pipeline that was representative and started gathering per-run statistics on the different instance families. We’re able to change the instance type by modifying the google-machine-type in the MachineOptions section under [runners.machine] in config.toml, then terminating all of the existing instances (either by deleting them in the GCP GUI or using docker-machine rm -y machine_name from the runner manager).
Because this is a relatively infrequent task, we didn’t automate the testing, instead manually stepping through the different instance types. The n1 instance types were straightforward, as were the n2 types, including evaluation of n2-standard-4. A strange thing happened on the c3 instances, though. They failed during preparation because they weren’t able to access the network. To double-check, we switched back to the last test using n2-standard-4 and everything worked fine. Digging in a bit further, we were able to reproduce the issue and replicate it on c3d (AMD) instances as well. Specifically the jobs consistently hang at this point:
fetch https://dl-cdn.alpinelinux.org/alpine/v3.15/main/x86_64/APKINDEX.tar.gz
After some research, it looked like the issue was likely related to the MTU. There are a number of different places one can configure the MTU, with most of the documentation referencing kubernetes (which we’re not running). Ultimately, the following configuration options in the config.toml for the runner manager solved this problem in our environment.
Configure the Gitlab runners to create a network per-build
Under the [[runners]] section in config.toml add the following:
environment = ["FF_NETWORK_PER_BUILD=1"]
This will cause the runner to create a user-defined Docker bridge network for each job.
Set the network_mtu
Under the [runners.docker] section in config.toml add the following:
network_mtu = 1460
This will set the MTU on the per-job networks.
Note that both options are required for this to work, and afterwards jobs are likely to be successful.
Conclusion
Once the MTU issue was resolved, we were able to successfully complete our testing. Ultimately, for our jobs we landed on a combination of n2-standard-2 and n2-standard-4 instances as representing the best option for performance and cost.
While the changes are relatively recent and the data is very noisy, we’ve been pleased with the results. Here is a chart from DataDog with the relative time for each stage of the pipeline that is executed most often.
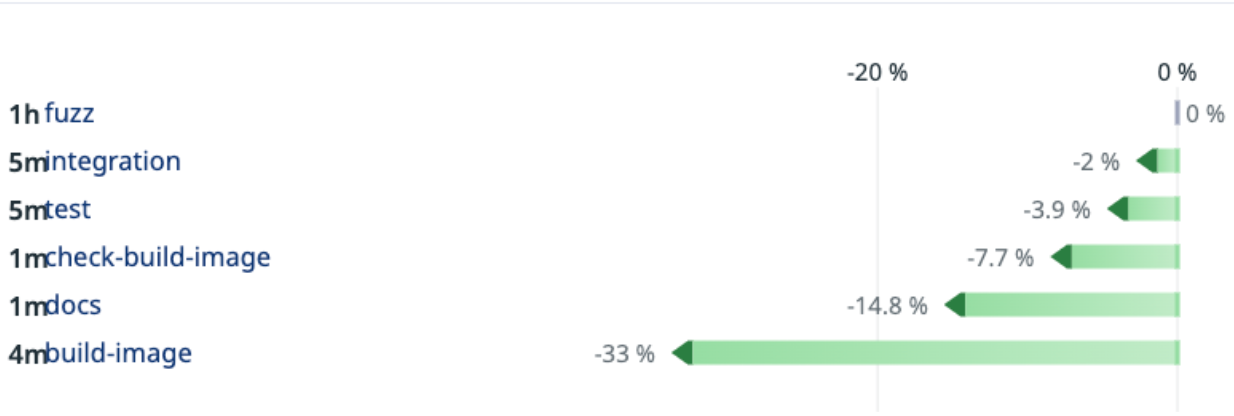
The fuzz job is configured to run for 1 hour, and the lack of change is expected. Every other stage is faster, in some cases significantly so.